Tous droits réservés pour tous pays. All rights reserved.
| Serveur © IRCAM - CENTRE POMPIDOU 1996-2005. Tous droits réservés pour tous pays. All rights reserved. |
Rapport Ircam 13/78, 1978
Copyright © Ircam - Centre Georges-Pompidou 1978
Abstract
Dissimilarity judgments of 15 synthesized naturalistic instrument tones of differing timbre were analyzed using the multidimensional scaling program, INDSCAL. In a two dimensional solution one axis was related to the distribution of energy in the time averaged spectrum and the other to characteristics of the temporal evolution of the components. This timbre space was on the whole consistent with those obtained in earlier studies. The space was used in a test of four models of timbre analogies. Forty multiple-choice timbre analogies of the form A is to B as C is to D1, D2, D3, or D4 were solved by listeners. A two dimensional parallelogram model best predicted subjects' responses in the analogy task. This model assumes that if the components of an analogy are embedded in a multidimensional space, then there is some ideal point in that space which completes a parallelogram given the firs three components of the analogy. The model predicts that, in the multiple-choice analogy task, the alternative which is closest to the ideal analogy point will be chosen as the best solution to the analogy. The results of the analogy experiment appear to support this prediction.
Musical timbre, as opposed to pitch and loudness, is a poorly understood auditory attribute. Technical definitions of timbre are typically formulated in a non-specific and often enigmatic way as the collection of perceptual attributes that remain after loudness and pitch have been accounted for. And with a few exceptions (Erickson, 1975), musical theory has not attempted a systematic account of the role of timbre in musical structure. The classical psychacoustical work on timbre has dealt only with steady-state tones (Helmholtz, 1877/1954 and Plomp, 1976). Musical tones, however, are rarely steady and sometimes show considerable variation in spectrum during the course of the tone. Recently, multidimensional scaling techniques (Shepard, 1962a, 1962b ; Kruskal, 1964a, 1964b ; Carroll and Chang, 1970) have been used to gain a better understanding of timbre perception. Using matrices of perceptual dissimilarity measures between the physical stimuli, multidimensional scaling attempts to represent the dissimilarities as distances between points in an n-dimensional space. In 8 direct application of multidimensional scaling to timbre perception, Wessel (1973) had listeners rate the dissimilarity of tones played on nine orchestal instruments. He embedded the instruments in a two dimensional Euclidean space. One dimension differentiated the different timbres by the distribution of energy in the steady-state region of the tones. The energy in the tones at one end of this dimension was located predominantely in the lower harmonics, while tones at the other end had more energy located in the higher harmonies. The second dimension was more difficult to interpret using a single physical characteristic of the tones. The tones tended to be grouped by family (i.e., brass, woodwinds, and strings). This dimension appeared to be related to temporal properties of the tones, particularly to differences in the attack segment. Wessel and Grey (1978) also scaled the similarity judgments of nine instrument tones reported by Wedin and Goude (1972). The results were similar to those described above and strongly supported the important role of attack transients in providing perceptual distinctions among instruments. Grey (1975) did a similar experiment with synthesized naturalistic tones. These tones were generated by using an analysis-based additive synthesis procedure. Using the heterodyne filter method (Moorer, 1977), Grey determined the time varying amplitude and frequency functions for each of the harmonies present in each of 16 orchestral instruments. He then simplified those complex functions by replacing them with straight line segment approximations. Using these simplified amplitude and frequency functions Grey generated his 16 stimulus tones. In a discrimination experiment Grey found that these tones were quite difficult to distinguish from the original tones. He then used multidimensional scaling to study the timbral relations among the 16 line segment approximation tones just described. His scaling solution yielded three dimensions. One dimension corresponded exactly to the dimension associated with the spectral energy distribution of previous studies. A second dimension reflected patterns in the onset-offset parts of the tones. At one extreme of this dimension all of the upper harmonies entered and exited synchronously ; at the other extreme the upper harmonies entered and exited asynchronously. In addition, the instrument families tended to be differentiated by this dimension. The third dimension focused an another aspect of the attack segment of the tones. Tones were differentiated by the presence or absence of high frequency, low amplitude, usually inharmonic energy, during the attack segment. Since two of Grey's dimensions were interpreted in terms of transient properties, it is conceivable that they are encompassed by Wessel's second dimension. The consistency of findings and the complementary nature of the results in these studies encourage one to extend the multidimensional model of timbre to more complex situations having more musical interest. In this report we attempt to shed some light on an idea proposed by the composer Schoenberg (1911). His idea was that melodic phrases could be formed by the sequencing of notes differing in timbre. Schoenberg suggested that such timbre melodies would possess an inner logic akin to that that is effective in the construction of melodies based on pitch.
Pitch patterns can be transposed and maintain their melodic identity. As a step toward uncovering a perceptual logic of timbre it seemed reasonable to see if one could transpose sequences of timbres as well. In our experiment we shall use the simplest of timbre sequences, one consisting of two notes. If we follow a note of timbre A by a note of timbre B we can then start another sequence with timbre C and ask what timbre will best complete the second sequence so that it sounds like a transposition of the first sequence. This is in fact an analogical reasoning problem of the form timbre A is to timbre B as timbre C is to "?".
Rumelhart and Abrahamson (1973) have presented an intuitively appealing theoretical model of analogical reasoning based on MDS techniques. They assume that the elements to be used in forming analogies have been embedded in a multidimensional space. Their model states that for an analogy of the form A:B:C:?, there is a theoretically ideal solution, "I", that forms a parallelogram with A, B, and C in the multidimensional space. In other words, there is some vector, CI, which is parallel to and equal in length to the AB vector. The coordinates of this ideal analogy point, I, can be computed from the following formula :
IJ = C(j) + B(j) - A(j), j = l,nwhere I(j), C(j), B(j), and A(j) refer to the coordinate on the jth dimension of points I, C, B, and A respectively and n is the dimensionality of the multidimensional space.
This model, which will be referred to as the parallelogram model of analogical reasoning predicts that for an analogy of the form A:B::C:(D1, D2, D3, D4), the probability that a particular alternative will be chosen as the best solution to the analoy is a monotonic decreasing function of the distance between that point and the ideal solution point, I, in the multidimensional space.
Rumelhart and Abrahamson (1973) found support for this model by using a three dimensional space of animal names obtained from a scaling study by Henley (1969).
An implicit assumption of the parallelogram model is that subjects are able to judge the similarity of the vectors involved in an analogy. If subjects are unable to appreciate the directional information implied by the concept of vectors, they might procede to solve an analogy by choosing the alternative D (the endpoint of the CD vector) that is most similar to B (the endpoint of the AB vector). This alternative hypothesis will be referred to as the similarity of terminal tones model. This similarity of terminal tones model gains intuitive appeal if thought of as a rhyming scheme. Just as syllable sequences that end the same rhyme, so too might timbre sequences that terminate similarily be judged in some sense to be analogous.
A second assumption is that subjects are able to use multidimensional information in solving an analogy. However, the task is complex and this assumption may not be true ; subjects may resort to using only the most perceptually salient dimension in solving an analogy. This possibility lives rise to two more alternative hypotheses.
The first of these salient dimension hypotheses is based on the parallelogram model. It states that subjects project the parallelogram onto the most salient dimension and proceed as in the parallelogram model.
The second salient dimension hypothesis is based on the similarity of terminal tones hypothesis. The prediction of this model is that the alternative D which is closest to tone B along the salient dimension will be selected as the best solution to an analoy.
The purpose of the following two experiments is to test whether Rummelhart and Abrahamson's parallelogram model will predict subjects' choices of the best solutions to timbre analogies more accurately than the three alternative hypotheses. As discussed previously, recent multidimensional scaling solutions for tones of different timbre (Grey, 1975 ; Wedin and Goude, 1972 as scaled by Wessel and Grey (1978) ; Wessel, 1973) have resulted in two or three interpretable dimensions. In Experiment 1, a scaling of 15 tones of different timbres gave rise to a two dimensional timbre space that is comparable to those found by other researchers. Experiment 2 used the scaling solution to test the various models of analogical reasoning in the timbre domain.
In the following experiments, subjects were asked to make judgements about 15 tones differing in timbre. These tones were generated using an analysis-based additive synthesis procedure. The tones were originally planed on the following musical instruments : oboes (01, 02), French horn (FH), bassoon (BN), E-flat clarinet (C1), bass clarinet (C2), flute (FL), saxophones (X1, X2, X3), trumpet (TP), English horn (EH), cello played normally (S2), cello played muted sul tasto (S3), and cello played sul ponticello (S1). All 15 tones were played near the pitch of E(b) above middle C (approximately 311 Hz) with durations between 280 and 400 milliseconds. These tones were originally taped and analysized by Grey (1975). Using the heterodyne filter method (Moorer, 1977), he obtained time-variant amplitude and frenuency/phase functions for each harmonic of each of the tones. Grey then replaced each of these rather complex time variant amplitude and frequency/phase functions with a small number of straight line segments.
The 15 tones used in this study were synthesized using an additive synthesis program implemented on a PDP-11/40 digital computer. Input data for the synthesis program were supplied by John Grey in the form of coordinate pairs indicating the break points of the straight line segment amplitude and frequency functions. The synthesis program used an interpolating table-look-up oscillator for each harmonic. The table stared one period of a sine function in a 512 point array with 16 bits of amplitude resolution for each point. The amplitude and frequency of each oscillator, were controlled by the line segment functions. Mathews (1969) and Moorer (1977) provide a general description of the digital oscillator used. A sampling rate of 25.000 samples per second was used and a sharp low pass filter removed the frequencies above 9k Hz.
The 210 possible pairs of the 15 tones were formed and randomized for each subject. Subjects were asked to judge the overall dissimilarity between the members of each pair. The tones were presented to subjects in a sound chamber via a 16 bit digital to audio converter (DAC) over a Philips 532 Motional Feedback loudspeaker. The DAC was constructed by the Three Rivers Computer Corporation (Kriz, 1975). Subjects sat approximately 0.75 meters from the speaker. The tones were presented in pairs ; to hear a pair, the subject pressed a button switch connected to the PDP-11. The subject was allowed to listen to each pair as many times as desired. The subject then made a dissimilarity judgment by adjusting a linear potentiometer. Each judgment, the position of the potentiometery was read by the computer, when a second button switch was depressed. Subjects were given 20 practice trials to become familiar with the procedure. Five musically sophisticated persons and five persons without musical training served as subjects.
Three, two and one dimensional MDS solutions were obtained by analyzing the dissimilarity judgments using the INDSCAL procedure (Carroll and Chang, 1970). The goodness-of-fit measure for INDSCAL is the correlation between the scalar products from the data and the distances in the solution. These goodness-of-fit measures are shown in Table 1.
Table 1. INDSCAL goodness-of-fit correlations Number of dimensions Correlation Three 0.65 Two 0.62 One 0.54
The two dimensional solution was selected because the correlations for the three and two dimensional solutions were nearly the same, while the correlation for the one dimensional solution is markedly lower. The two dimensional solution seemed an adequate representation of the data. An examination of the subjects' weight space for the three dimensional solution shown in Figure 1 yields yet another reason for choosing the two dimensional solution. Subject U4 was the only one to place any weight on the third dimension.
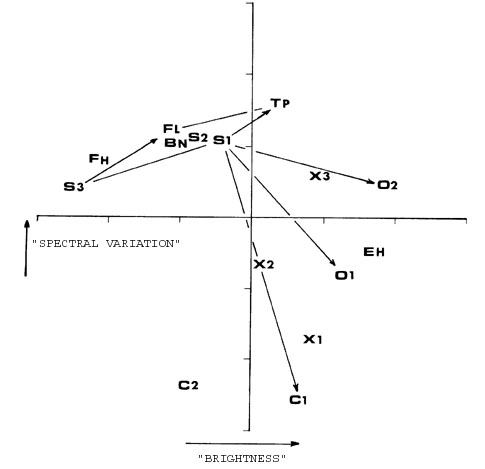
Figures 2 and 3 show the INDSCAL subjects' weight space and group timbre space in two dimensions. In addition a sample analogy problem from Experiment 2 is shown superimposed upon the space in Figure 3. The horizontal dimension of the timbre closely corresponds to the spectral energy distribution dimension found previously by both Wessel (1973) and Grey (1975). At one extreme are the tones, from instruments such as the French horn and the cellos, which have most of there energy located in the lower harmonies. At the other extreme are the tones, such as those produced by the saxophones and oboes, which have more of their energy located in the higher harmonies. One can think of this as a mellow to bright continuum. This spectral energy distribution dimension is here the most perceptually salient of the dimensions, as it was in previous research. The first moment of the average amplitude of the harmonics can be used as a quantitative measure of this energy distribution dimension. The average amplitude of the kth harmonicy AA(k) was computed as :
where f(t) = the amplitude of the kth harmonic at time t, a = the start time of the tone, and b = the stop time of the tone. The first moment of the average amplitudes for a tone was calculated as :
where M = the first moment, k = the harmonic number and n = the number of harmonics in the tone. This measure of the frequency location of the energy, distritbution is highly correlated (r = 0.85) with the X coordinates of the INDSCAL solution. This property is called "brightness" in Figure 3.
As in previous work, the second dimension appears related to the extent to which frequency components of the spectrum evolve in a synchronized manner. At one extreme one has the flute and trumpet both of which show considerable spectral fluctuation during the note, particularly during the attack segment. At the other extreme are the clarinets whose spectral variation as a function of time is minimal. This property is called "spectral variation" in Figure 3.
A comparison of the two dimensional INDSCAL solution with a two dimensional projection of Grey's (1975) Y and X dimensions reveals that these two scaling solutions are very similar in structure and interpretation.
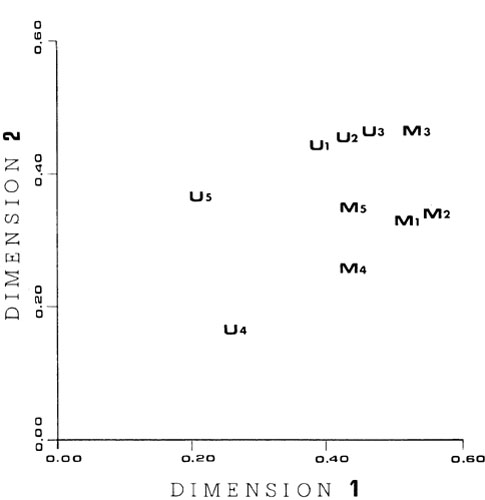
As can be seen from the subjects weight space shown in Figure 2, there were no systematic differences between the musically sophisticated subjects and those with no musical training. Three of the untrained subjects and the five musically sophisticated subjects gave approximately equal weight to both dimensions. Subject U5 gave less weight to the first dimension than did the others, while subject U4 had low weights an both dimensions.
Fig. 1
Perceptual salience weights derived from the INDSCAL individual differences multidimensional sealing model. The points in this space represent the subjects in the timbre dissimilarity judgment experiment. "M" indicates a musically trained subject and 'U" a subject without musical training. The cooridinates of each subject indicate the relative importance of dimensions 1 and 3 in the subject's assesment of perceptual dissimilarity. Except for subject U4, dimension 3 appears to be of little importance.
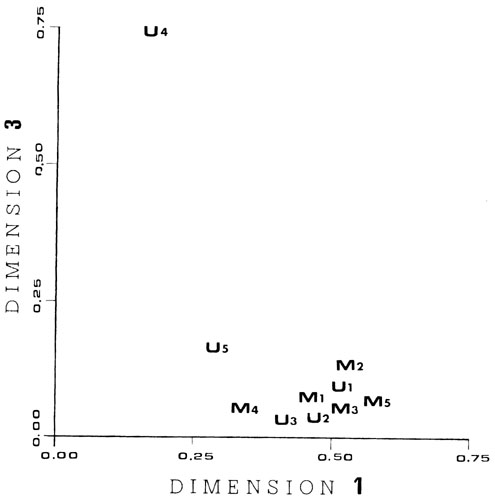
Fig. 2
Perceptual salience weights for the 2 dimensional timbre dissimilarity space shown in Fig. 3. "M" indicates a musically trained subject and "U" a subject without musical training. The coordinates of each subject indicate the relative importance of dimensions 1 and 2 in the subject's assesment of perceptual dissimilarity.
In this experiment, Rumelhart and Abrahamson's (1973) parallelogram model of analogical reasoning was tested using the timbre space derived in Experiment 1. Twenty multiple choice timbre analogies of the form A is to B as C is to D(1), D(2), D(3), or D(4), were formed as follows : the 15 tones were arranged in random order ; the first three in this order were chosen as A, B, and C of the first analogy, the second three were used to form the second analogy and so on. When the list was exhausted the tones were rerandomized and the procedure repeated until 20 analogies had been formed. For each of the analogies thus formed, the coordinates of the ideal analogy point, I, were calculated and the distances between each of the remaing 12 tones and I were computed. Four alternative solutions to the analogs were chosen such that each analogs had an alternative in each of the following ranges : 0.00-0.25 units from I, 0.25-50 units from I, 0.50-0.75 units from I, and 0.75-1.00 units from I. The units which were used are the ones produced by the INDSCAL program as shown in Figure 3. If it was not possible to choose alternatives to meet these conditions, that analogy was discarded and another one formed as above. If more than one tone fell within a given range, the one closest to the lower boundary was chosen. The four chosen alternatives were also ordered randomly for each subject.
If A is to B as C is to D, then it should be the case that A is to C as B is to D. In terms of the parallelogram model, the above two analogies are exactly the same parallelogram. Therefore, for each of the 20 analogies formed above, another analogy was formed which had the same components but had the second and third elements reversed. In other words, the analogies were of the form A:C::D:(D(1), D(2), D(3), D(4)).
The analogies were presented to subjects using the audio setup described in Experiment 1. A trial consisted of the four alternative forms of an analogy A:B::C:D(n) ; where D(n) is one of the four alternative solutions. Subjects could hear an alternative form by depressing one of four button switches ; each alternative form was randomly associated with one switch. These switches were mounted in small movable boxes attached by individual cables. The subjects were able to listen to the alternatives in an ad-lib fashion. Each subject then arranged the button boxes to reflect the rank order of the of how well the various alternatives completed the analogy. To enter the analogy quality ordering into the computer the subject pressed another button and then entered the ordering of the boxes.
Nine of the ten listeners who served as subjects in Experiment 1 also served in Experiment 2. Subject M3 was unable to participate.
To provide an initial comparison among the four models only the alternatives ranked in the first position and those ranked in fourth position are considered. Each of the analogy models predicts that the probability of choosing an alternative as the best solution decreases monotonically with the distance of that alternative from the ideal solution point specified by the model. In addition, the four models predict that the probability of ranking an alternative as the poorest solution increases monotonically with the distance from the ideal solution point. With this feature in mind, correlations assuming only a monotonic relation were computed. The correlations were calculated using the MORALS program (Young et al, 1976). The MORALS procedure used an alternating least-squares approach to find a montone transformation on the distance from the ideal solution point that produced the strongest linear correlation between this transformed variable and the proportion of analogy choices. Table 2 shows the merely monotone correlations for each of the analogs models. These correlations show the parallelogram model predicting subjects's best and poorest rankings better than any of the alternative hypotheses.
Table 2. Goodness-of-fit correlations for the analogy models. Model Correlation Rank 1 Rank 4 Parallelogram -.54 .66 Similarity of terminal tones -.42 .45 Salient-dimension - parallelogram -.38 .47 Salient-dimension - terminal tones -.32 .34
For a more detailed comparison among the four models, Table 3 giving the distribution of rankings for each of the four alternative analogy solutions was constructed. Recall that the sounds presented to the subjects as alternive solutions were chosen in according to their distances from the ideal solution point determined by the parallelogram model. The four proposed solutions were selected from four graded ranges of distances from the ideal solution point. Using the same distance intervals as given before in the method section for the analogy experiment it is also possible to determine to which distance categories the four solutions belong for the other models. Each model gives an ideal solution point ; to find the distance catemorY to which an alternative belongs one centers the category boundries around the appropriate ideal solution point and notes in which ranges the alternatives fall. In computing the proportions in Table 3 all 40 analogy problems for all 9 subjects were used. For each problem the distance category for an alternative was determined in accord with the model under consideration and the frequency distribution of rankings as calculated. For a given distance category the row of the table shows this distribution of rankings. The sample size is given at the end of each row. While there are possible objections to the comparisons among the models shown in Table 3, inspection of pattern of proportions shows the parallelogram model qualitatively superior to the others. We arrive at this conclusion by noting that the tendency for the assigned rank proportions to be less flatly distributed for the parallelogram model and with one exception that is indicated with the double headed arrow to be in wood agreement with the orderings of proportions given by the model.
Given that there is no systematic clustering in the INDSCAL subject's weight spacer, it is not surprising that there are no systematic differences in the analogy judgements attributable to musical training. Table 4 summarizes the data from the musically sophisticated subjects ; Table 5 gives the data for the musically untrained subjects. These two tables use the distance ranking provided by the parallelogram model only. As one would expect, there are no systematic differences between these two tables and their entries are highly correlated (r = 0.89).
Table 3. Distribution of subjects's responses averaged over all subjects and all analogies for the four models. Parallelogram Model Distance category
of the alternative from
ideal solutionListener-assigned Rank
J1 2 3 4 N 1 .422 .303 .156 .119 360 I 2 .322 .283 .217 .178 360 3 .169 .267 .358 .206 360 4 .086 .147 .269 .497 360 Terminal Tones Model Distance category
of the alternative from
ideal solutionListener-assigned Rank
J1 2 3 4 N 1 .418 .284 .131 .167 306 I 2 .264 .280 .269 .186 549 3 .145 .230 .323 .302 387 4 .157 .151 .237 .454 198 Salient-dimension Parallelogram Model Distance category
of the alternative from
ideal solutionListener-assigned Rank
J1 2 3 4 N 1 .328 .286 .197 .189 756 I 2 .208 .264 .301 .227 432 3 .088 .116 .319 .477 216 4 .083 .139 .333 .445 36 Salient-dimension Terminal Tones Model Distance category
of the alternative from
ideal solutionListener-assigned rank
J1 2 3 4 N 1 .422 .303 .156 .119 603 I 2 .322 .283 .217 .178 558 3 .169 .267 .358 .206 216 4 .086 .147 .269 .497 63
Table 4. Distribution of subject's responses averaged over all musically sophisticated subjects and all analogies. Rank distance is determined by the parallelgram model. Distance category
of the alternative from
ideal solutionListener-assigned Rank
J1 2 3 4 N 1 .406 .331 .131 .131 160 I 2 .325 .294 .219 .162 160 3 .213 .187 .375 .225 160 4 .056 .187 .275 .481 160
Table 5. Distribution of subject's responses averaged over all musically untrained subjects and all analogies. Rank distance is derived by the parallelogram model. Distance category
of the alternative from
ideal solutionListener-assigned Rank
J1 2 3 4 N 1 .435 .280 .175 .110 200 I 2 .320 .275 .215 .190 200 3 .135 .330 .345 .190 200 4 .110 .115 .265 .510 200
Analogies of the form A:B::B:D(n) should work as well as those of the form A:B::C:D(n). Tables 6 and 7 summarize the data for these two forms of the analogies.
Table 6. Distribution of subjects' responses averaged over all subjects and analogies of the form A:C::B:D(n). Rank Distance
of the alternative from
ideal solutionListener-assigned Rank
J1 2 3 4 N 1 .389 .344 .167 .100 180 I 2 .361 .283 .200 .156 180 3 .189 .239 .367 .206 180 4 .061 .133 .267 .539 180
Table 7. Distribution of subjects' responses averaged over all subjects and analogies of the form A:B::C:D(n). Rank Distance
of the alternative from
ideal solutionListener-assigned Rank
J1 2 3 4 N 1 .456 .261 .144 .139 180 I 2 .283 .283 .233 .200 180 3 .150 .294 .350 .206 180 4 .111 .161 .272 .456 180
The fact that the distribution of the subject's rankings of analogy solutions showed clear and consistent preferences for certain analogy solutions over others demonstrates that a sort of analogical reasoning is possible with purely sonic and non-verbal objects whose pitchy subjective duration, and loudness properties remain fixed. Furthermore, this pattern of preference does not appear to depend on musical training and its accompanying familiarity with musical instrument sounds and tendanecy towards a more analytic listening attitude. It should be emphasized that the existance of these prefered analogical relations among tones is quite independent of the fact that there appears to be a relationship between the pattern of analomy solution rankings and the structure of the timbre space derived by the multidimensional scaling of timbre similarity judgments.
With respect to this latter point on the prediction of the goodness of an analogical relation from the timbre space, it appears that the paralleogram model fairs a bit better than the proposed alternative models but two different objections can be raised. First, on an absolute basis, why does not the parallelogram live a better account of the analogy judgments ? The merely monotonic correlations in Table 2 between the distance that a given alternative solution is from the ideal solution point and the estimated probability that that solution will be ranked as a best or poorest solution are reasonable but not as high as the better than .90 correlations reported by Rumelhart and Abrahamson (1973). As well, Rumelhart and Abrahamson's ranking distributions for the parallelogram model are considerably less flat that those reported in the tables of the previous section. Overall, Rumelhart and Abrahamson's application of the parallelogram model provides a better account of the analogy judgments than the application reported here. This difference in parallelogram model adequacy between the two studies might be accounted for on in terms of the quality of the multidimensional space used for characterizing the objects. In the Rumelhart and Abrahamson study the Henley (1969) animal name space of 30 points in three dimensions was used. Our study used only 15 points in two dimensions. Futhermore, the goodness-of-fit measure for the the Henley space was better. Their Kruskal stress index was 9.4% in three dimensions. To obtain a comparable measure for our INDSCAL determined timbre space, the coordinates of this space were supplied to the Kruskal algorithm as a two dimensional starting configuration and the stress for this configuration was computed yielding 28.7%. It might be argued then that Rumelhart and Abrahamson started with a better space -- more dimensions, more points, and a better overall fit -- than was used in our study. And indeed, the quality of the space upon which the analogy problems are based places a kind of upper limit on the quality of fit of any analogical reasoning model subsequently based on this space. This limit is similar in character to that imposed by measurement reliabilty upon validity in classical mental test theory (Gulliksen, 1950).
Second, though the alternative models do not fit as well overall as the parallelogram model, the fits are nonetheless reasonable. The correlations shown in Table 2 are all different from 0 in a direction favorable to each model and the general pattern of the ranking distributions shown in Table 3 is with few exceptions in agreement qualitatively with each theory. This can be explained by taking a casual look at the geometry of the situation which shows the models to make somewhat similar predictions for many of the analogy problems. The ideal solution points for the terminal tones models and the parallelogram models are often promimate and never greatly distant from each other.
These observations suggest that an important step would be to carry out an analogy experiment based on a more orderly timbre space. Assuming that the basic interpretation of our timbre space is correct, it should be possible to construct a space by appropriate methods of interpolation in which tones actually occur at the ideal analogy points. In such a space filled out by interpolation, it would also be possible to select more carefully the alternative solutions, thus providing more critical and direct tests of the different models.
On the whole, the results suggest some interesting and challenging avenues for composers. Purely timbre analogies are perceivable and their behavior appears predictable from an underlying timbre space. Indeed, the concept of melodic transposition might now be extended from the domain of pitch to that of timbre.
____________________________
Server © IRCAM-CGP, 1996-2008 - file updated on .
____________________________
Serveur © IRCAM-CGP, 1996-2008 - document mis à jour le .