
Tous droits réservés pour tous pays. All rights reserved.
| Serveur © IRCAM - CENTRE POMPIDOU 1996-2005. Tous droits réservés pour tous pays. All rights reserved. |
Rapport Ircam 31/80, 1978
Copyright © Ircam - Centre Georges-Pompidou 1998
Using forced choice technique, subjects matched a band of noise approximately a critical bandwidth wide with another band of equal width which was progressively filled with random phased, equal amplitude sinusoids whose frequencies randomly but uniformly filled out the band.
The bandwidths chosen were : 100-175 Hz, 400-510 Hz,1270-1480 Hz, 3700-4400 Hz. The number of sinusoids varied between 3 and 25. For the first three bandwidths findings show the point of subjective equivalence (PSE) to occur in the neighborhood of 15 sinusoids.
Room acoustics seem to play an important role in determining the PSE. Fewer sinusoids are needed in a reverberant environment than in a dry one.
The answers to these questions are of interest not only to those who are concerned with developing a theory of hearing, but also to those who are affected by the practical implications, such as modern instrument builders and composers. A synthesizer builder may want to know how many oscillators he needs to effectively cover the auditory range. A composer interested in complex vertical structures may want practical information regarding the perceptibility of these structures. Recently, spectral density was a topic of discussion in a series of lectures by Pierre Boulez (1).
The idea of spectral density is not new. Experiments on the frequency selectivity of the ear carried out by Schafer et al. (2) made use of synthetic noise in their masking experiments. The synthetic noise was constructed by adding large numbers of sinusoidal components. Tests to determine the number of sinusoids needed to simulate a 32 Hz band of noise showed that a frequency spacing of 1 Hz was necessary. Their work implied, of course, that more sinusoids were needed to synthesize noise for wider bands than for narrower bands. Here the experimental paradigm differed from that of Schafer et al. only in the bandwidths chosen for the noise. Since this experiment was in fact concerned with the resolving power of the ear and therefore the auditory filter (critical band), the bandwidths were measured in barks. And so the bandwidth used here was always one bark (one critical bandwidth) based on the data provided by Scharf (3).
Some of the experimental findings were, of course, unexpected and not immediately obvious. For this reason and because of practical considerations of presentation, the results are not presented in the chronological order of the actual tests. Instead, an attempt is made to present the basic findings in a logical fashion on an issue by issue basis.
As shall be seen below, reverberation and roughness play important roles in the determining the PSE.
The second room was a small studio which shall be called the small room (SR). It measured approximately 5 m. by 4 m. and contained many absorbing surfaces (cloth covered walls, carpet). The average distance between the loudspeakers and subjects was 1.5 m.
The band-limited noise was produced by generating normally distributed random numbers which were computed by the exact method described by Knuth, using Algorithm P, the Polar method for Normal deviates (4). The noise was then filtered by a 12th order bandpass filter which was simulated digitally, thus giving a 36 dB per octave rolloff on each skirt. The filter was calculated from the Butterworth approximation which was chosen for its relatively low level of ringing. The Butterworth filter was then transformed to the digital domain by use of the bilinear transform, taking into account the frequency transformation necessary to make the 3dB points lie exactly at the desired frequencies. Informal listening tests with higher order bandpass filters indicated little or no change in the sound quality with increase in order beyond 12. In all cases the signals were 1.5 S long with rise and decay times of 20 msec. The program to make the BLN was written in the programming language SAIL by James A. Moorer.
The synthetic noise (SN) was produced using the MUSIC-10 program from Stanford University. The space between the upper and lower limits of the critical band was divided logarithmically by the number of sinusoids desired in the space. Each frequency thus obtained was then multiplied by .003 to obtain a number which when added and subtracted from the original frequency would provide the upper and lower limits within which a random number was chosen. In this way the space within the critical band was filled out in a uniform but random fashion. All sinusoids were random phased. The amplitude of each sinusoid was calculated by
where A is the amplitude of each sinusoid, a the maximum amplitude available in the Music 10 program, and N the total number of sinusoids. As with the BLN, each SN was 1.5 S long with rise and decay times of 20 msec.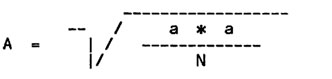
The test for each critical band was carried out in the following manner. The test began with a warning signal consisting of four short beeps at intervals of .5 S. The subject was then presented 19 times with the task described next. Following a warning beep the subject heard three noises (two BLN and one SN) separated by pauses of .5 seconds. The subject then had to say which of the three noises was the SN. Five seconds were provided to write down the answer. At the end of the five seconds the warning beep for the next task was heard and so forth. During each test, therefore, the subjects heard a total of 57 noises (19 SN and 38 BLN). Each BLN was different in order to avoid giving cues through repetition. Each of the 19 SN contained a different number of sinusoids. The SN contained from 3 to 25 sinusoids. (These figures were arrived at through informal listening tests.) The position of the SN in each task was chosen at random. Furthermore, the number of sinusoids in each SN was randomly varied task by task.
In two of the tests the BLN was replaced in each task by SN containing 100 sinusoids. This type of noise shall be designated SN100 to distinguish it from the SN containing 3, 5, 7, 9 .... 25 sinusoids. As with the BLN, 38 different SN100 were made for each test in which the SN100 was used.
As mentioned before, each test was done with a tape which was played over two loudspeakers in front of the subjects. The level for each of the tests was approximately 80 dB. The subjects were both male and female with an average age of 35 years. About half were musicians.
When several tests were done consecutively in one testing session, a rest period of about 2 minutes was given between each test. The largest number of consecutive tests was 5, which made for a total testing time of about 25 minutes. There were four testing sessions with different subjects each time.
The chronological order of the tests may be seen in Table I which gives for each test the result code number, bandwidth, room, type noise used (BLN or SN100), number of subjects, number of times the test was done, and the number of the testing session.
These raw data were fit with a simple exponential curve of the form
Ae-Bk + .333(where k is the number of sinusoids) by a nonlinear least squares optimisation program which used the Marquart iteration. The parameters A and B were thus adjusted to minimize the error between the exponential curve and the experimental data. The curve fitting program was written in SAIL by James A. Moorer. Figs. 1, 2, and 3 reveal three interesting facts. (In the discussion below we shall adopt an arbitrary figure of 50% correct for the PSE.)
Fig. 5 compares the results for the 3700-4400 Hz critical band with the three others discussed so far. It is immediately obvious that there is a very noticeable difference in performance. At first it was thought that the subjects might be getting some kind of spectral cue from the BLN which made it easy to choose the correct position of the SN. Following a suggestion by Max Mathews, the test was repeated with the SN100 replacing the BLN. The results of that test together with the test using the BLN are shown in Fig. 6. The results are nearly identical. It should be noticed that the test with the SN100 was done in the SR. In contrast to the results in Figures 1, 2, and 3, the difference in room acoustic seems to make no difference in the performance of the subjects.
Fig. 7 compares the results of the 400-510 Hz critical band using on the one hand the BLN and on the other the SN100. The performance in each case is very similar. This would seem to suggest that in fact there is no substantial difference between using the SN100 and the BLN.
Fig. 8 shows the effect of narrowing the 3700-4400 Hz critical band by 100 Hz to 3700-4300 Hz. There is a clear decrease in performance on the part of the subjects. The curve for this poorer performance is actually very close to the SR results for the first three critical bands studied.
Fig. 9, in contrast to Fig. 8, shows the effect of widening the 1270-1480 Hz critical band by 90 Hz to 1270-1570 Hz. Widening the band seems to improve performance.
Recent experiments by Terhardt (5), (6), (7) have revealed two important facts regarding roughness.
Other experiments measuring the roughness of two beating tones by Plomp and Steeneken (8) are generally in agreement with those of Terhardt. For frequencies > 3000 Hz the ROB is less than the critical bandwidth. At 4000 Hz for example the ROB is approximately 400 Hz whereas the critical bandwidth in this region is approximately 700 Hz.
It will be recalled that the results shown in Figs. 1, 2, and 3 showed that approximately the same number of sinusoids were needed in the SN to simulate the BLN in each of the bandwidths studied. This suggests a strong correlation between the number of sinusoids needed and the critical bandwidth or the ROB which in the regions studied, is equal to the critical bandwidth.
Fig. 6 showed a very high performance for the 3700-4400 Hz band in both the LR and the SR. The fact that this bandwidth of 700 Hz exceeds the ROB in both studies mentioned above may explain why the results were so different for the highest bandwidth studied. In order to have had performance levels comparable to the ones in Figs. 1, 2, and 3, it is likely that for the highest band studied the bandwidth should have been smaller and perhaps close to either of the ROB figures given above. The results in Fig. 8 for the narrowed band would tend to support this likelihood.
If in fact the number of sinusoids needed to simulate BLN is correlated with the RDB, as the present study would seem to suggest, then the number of sinusoids needed per critical band would be the same in the region below 2000 Hz, and for each successive critical band above 2000 Hz the number would increase.
Figs. 1, 2, and 3 would seem to suggest that reverberation plays a role in determining the spectral density saturation threshold. Since the SR was considerably less reverberant than the LR it is likely that the subjects were able to hear more clearly the amplitude fluctuations and therefore be in a better position to give a correct answer.
On the other hand the objection might be made that in Fig. 5 the SR did not improve the performance for the 3700-4400 Hz band. The issue is further complicated by the fact that the test in the SR was done with a different kind of noise (the SN100). It will be recalled that Fig. 7 shows that there is a great similarity in performance when either the BLN or the SN100 is used. Furthermore, as shown in Fig. 9, widening the bandwidth improves performance. In the light of these two points it would not be unreasonable to suggest that the similarity of performance was due to the fact that the bandwidth was wider than the ROB (by a factor of 2) and that therefore the subjects were presented with relatively easy tasks where reverberation did not play a very large role.
| Code number | Bandwidth | Room | Noise used | Num. subj. | Num. times test done | Test session number |
|---|---|---|---|---|---|---|
| R1 | 100-175 Hz | LR | BLN | 14 | 1 | 1 |
| R2 | 400-510 Hz | LR | BLN | 14 | 1 | 1 |
| R3 | 1270-1480 Hz | LR | BLN | 14 | 1 | 1 |
| R4 | 3700-4400 Hz | LR | BLN | 14 | 1 | 1 |
| R5 | 100-175 Hz | LR | BLN | 14 | 1 | 1 |
| R6 | 3700-4400 Hz | SR | SN100 | 7 | 1 | 2 |
| R7 | 400-510 Hz | SR | SN100 | 13 | 1 | 2 |
| R8 | 3700-4300 Hz | SR | BLN | 7 | 1 | 3 |
| R9 | 1270-1570 Hz | SR | BLN | 7 | 1 | 3 |
| R10 | 100-175 Hz | SR | BLN | 5 | 1 | 4 |
| R11 | 400-510 Hz | SR | BLN | 5 | 1 | 4 |
| R12 | 1270-1480 Hz | SR | BLN | 5 | 1 | 4 |
Code number Symbol Bandwidth Noise used Num. subj. Room R1 ---- 100-175 Hz BLN 14 LR R10 ++++ 100-175 Hz BLN 5 SR
Code number Symbol Bandwidth Noise used Num. subj. Room R2 ---- 400-510 Hz BLN 14 LR R11 ++++ 400-510 Hz BLN 5 SR
Code number Symbol Bandwidth Noise used Num. subj. Room R3 ---- 1270-1480 Hz BLN 14 LR R12 ++++ 1270-1480 Hz BLN 5 SR
Code number Symbol Bandwidth Noise used Num. subj. Room R1 ---- 100-175 Hz BLN 14 LR R5 ++++ 100-175 Hz BLN 14 LR
Code number Symbol Bandwidth Noise used Num. subj. Room R4 ---- 3700-4400 Hz BLN 14 LR R5 ++++ 100-175 Hz Hz BLN 14 LR R2 xxxx 400-510 Hz BLN 14 LR R3 .... 1270-1480 Hz BLN 14 LR
Code number Symbol Bandwidth Noise used Num. subj. Room R4 ---- 3700-4400 Hz BLN 13 LR R6 ++++ 3700-4400 Hz SN100 7 SR
Code number Symbol Bandwidth Noise used Num. subj. Room R7 ---- 400-510 Hz SN100 13 SR R11 ++++ 400-510 Hz BLN 5 SR
Code number Symbol Bandwidth Noise used Num. subj. Room R6 ---- 3700-4400 Hz SN100 7 SR R8 ++++ 3700-4300 Hz BLN 7 SR
Code number Symbol Bandwidth Noise used Num. subj. Room R12 ---- 1270-1480 Hz BLN 5 SR R9 ++++ 1270-1570 Hz BLN 7 SR
____________________________
Server © IRCAM-CGP, 1996-2008 - file updated on .
____________________________
Serveur © IRCAM-CGP, 1996-2008 - document mis à jour le .