
Tous droits réservés pour tous pays. All rights reserved.
| Serveur © IRCAM - CENTRE POMPIDOU 1996-2005. Tous droits réservés pour tous pays. All rights reserved. |
ICMC: International Computer Music Conference, Thessaloniki, Greece, Septembre 1997
Copyright © Ircam - Centre Georges-Pompidou 1997
Roughness was originally defined by Helmholtz [6] to provide a sensory basis for musical consonance. A basic feature of Western tonal harmony is to distinguish within the ensemble of possible intervals obtainable with the chromatic scale those that are considered consonant from those that are considered dissonant. This distinction is of course by no mean rigid, as shown by the progressive shift from dissonance to consonance of some intervals throughout the history of music. However, as has been noted since Pythagoras, intervals made of simple integer ratios are situated at one extreme of the scale (consonant) whereas the more complex ratios are considered dissonant. Numerous theories have been proposed to account for this enigma, and Helmholtz provides one of them: as the ratio between two sounds involves more complex integers, more partials will be ``mistuned'' and create roughness. Since the dissonance of Western tonal intervals corresponds to their roughness, this attribute may be proposed as a sensory basis upon which the complex rules of harmony were built. Cross-cultural studies involving American and Japanese listeners [3] did show some agreement on judgments of simple isolated intervals according to their consonance.
Along with other factors such as melodic motion or implicit knowledge of tonal pitch space hierarchy, dissonance is considered to play a part in the expression of an important feature of tonal music: tension and release movements. A dissonant chord is considered unstable, calling for a resolution on a more consonant chord. As a potential source of sensory dissonance, roughness was shown [2] to play a part in the expression of these schemas in tonal contexts.
A correspondence between a sensory feature and a musical notion takes on a new interest when listeners are confronted to music not leaning on internalized syntactic rules. In such a case, a previous study [10] showed that tension movements could nevertheless clearly be perceived by musician or non-musician listeners. Roughness appeared as strongly correlated to the tension judgments. As the material tested had no harmonic tonal function, its roughness value could provide a relevant indication for the composer. Naturally, music is (generally) more than a juxtaposition of sound events and a relative roughness value of an isolated chord will not determine a harmonic function in the time course of a piece. Nevertheless, roughness estimation of musical material can be, in our view, a relevant parameter in the framework of computer-aided composition environments.
A different approach consisted in studying the influence of temporal parameters, by means of amplitude-modulated stimuli. Terhardt [11] demonstrated a dependence of roughness on the frequency and depth of the modulation. He also found that differences in roughness can be measured for sounds having the same amplitude spectrum but different waveform envelopes. The hypothesis he advanced is that roughness is determined by the envelope fluctuations of the signal within an auditory filter. Models have therefore been developed in which roughness estimates are based on the magnitude of temporal fluctuations of the signal envelope after auditory filtering ([4] for instance).
In the general case, the spectral and temporal cues are strongly covariant. An experiment has therefore been designed to oppose them in order to provide quantitative experimental data relevant to a discussion of the concurrent approaches. In addition, some authors claimed that roughness differences could be heard for sounds having the same envelope and frequency composition. This point, still lacking experimental evidence, will be addressed as well.
 c - m, c, c + m}, with relative amplitudes {1/2,1,1/2}, and with initial phases of {0,
  , 0}. For = 0,
a 100% sinusoidally amplitude modulated sound with center frequency
c and modulation frequency m is obtained. By varying , a
family of sounds that have the same amplitude spectrum but different
temporal structures is obtained. We will refer to these as
``pseudo-AM'' (pAM) stimuli. If changes, the shape of the
temporal envelope usually varies. It is also possible to obtain the
same amplitude spectrum and the same envelope, but a different
temporal fine structure by creating pAM signals corresponding to
= +
, 0}. For = 0,
a 100% sinusoidally amplitude modulated sound with center frequency
c and modulation frequency m is obtained. By varying , a
family of sounds that have the same amplitude spectrum but different
temporal structures is obtained. We will refer to these as
``pseudo-AM'' (pAM) stimuli. If changes, the shape of the
temporal envelope usually varies. It is also possible to obtain the
same amplitude spectrum and the same envelope, but a different
temporal fine structure by creating pAM signals corresponding to
= + and = - with
  ]0,
]0, /2].
/2].
Seven series of pAM stimuli were created in which a given center
frequency and ``modulation'' frequency were associated. In each case,
m was chosen to produce maximum roughness for a pure tone of
frequency c modulated sinusoidally at m. The phase of
the central component was varied from - /2 to + /2 in steps
of /6. For each series, seven stimuli were thus produced with
four different envelopes corresponding to the four absolute phase
differences (characterized hereafter by their rms value).
Stimuli were presented over headphones to listeners. Center
frequencies were arranged in randomized separate blocks, and within a
block all 42 pairs of nonidentical stimuli in both orders were
tested. For each pair, listeners were asked to decide which sound was
rougher (2AFC). The notion of roughness was introduced with the help
of amplitude-modulated sounds the modulation depth of which the
listener could vary in a continuous fashion, thus changing
concomitantly the amplitude spectrum and envelope. Two groups of 15
listeners were presented two different sets of cs.
The Bradley-Terry-Luce (BTL) method was used to construct a roughness scale derived from the binary paired-comparison judgments. In order to test whether differences between scale values are significant, they must be compared to the standard deviation of the results. The standard deviations were estimated nonparametrically by the bootstrap technique. The results for the seven series of stimuli are presented in Figure 1.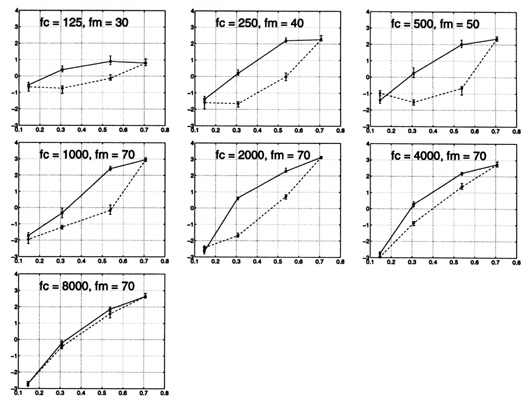
Figure 1. Results for the seven stimulus series corresponding to different center frequencies. The roughness value estimated by the BTL method is plotted as a function of the rms value of the amplitude envelope of the signal. Solid lines represent
The relatively small size of the standard deviations indicates a
strong agreement across subjects. The most obvious factor
contributing to roughness is the envelope rms, greater envelope
rms corresponding to higher roughness values. This effect is
similar in range across most cs tested although there is a
decrease in range for low cs. However, for cs at or below
4 kHz there is also a strong effect of the sign of , indicating
a significant contribution of phase for stimuli with the same overall
envelope and the same amplitude spectrum. This effect disappears for
all cs at =  /2 and for all phases for c = 8 kHz.
m and c is in agreement with the temporal models of
roughness. We interpret the overall range reduction of variation at
lower frequencies in terms of a critical bandwidth effect, as the
frequency span of the pAM is much greater compared to the critical
band at these cs. This suggests that the effect of global
envelope, when manipulated by phase relationships, is all the more
important when the three components can interact.
The observed significant influence of phase for a given envelope and
amplitude spectrum is not expected with the envelope fluctuation
hypothesis. A spectral interpretation may be proposed to account for
this result: combination tones (CTs) generated by the three components
of the pAM stimuli may have played a role in the roughness judgments.
Among these tones, the first order cubic difference situated at
2(c)-(c+m) = c -m interacts with the acoustic component at
the same frequency. Its phase and amplitude change as a function of
phi, which may explain the differences observed in perceived
roughness [1]. This interpretation nevertheless raises two
questions. First, the phase effect disappears at c= 8 kHz,
whereas combination tones are likely to be still present. To
accommodate this finding, one would have to accept that the phase of
the CTs does not change with the phase of the primaries in this high
frequency region. Second, a large intersubject variability is
generally observed in the phase dependence of the combination tone on
the phases of the primaries. Our results display on the contrary a
remarkable agreement between listeners.
A second framework consists in trying to link the roughness judgments
to the temporal fine structure differences between stimuli. To assess
these differences, a computational model that mimics the auditory
system was used. A large variety of these models exist that present
very similar characteristics. We chose to generate ``neural activity
patterns'' by means of compression, rectification and 2-dimensional
adaptive thresholding of the output of a gammatone filter-bank
[8]. These patterns are intended to simulate the neural
responses (along the cochlea) to the stimuli. Examination of the
simulations indeed showed that the patterns produced by the opposite
phases had different shapes. In the positive phase condition, the
modulation shows a well defined maximum, that resembles the zero-lag
condition, whereas the negative condition displays a ``smoother''
shape. This difference disappears for the /2 condition, as well
as for the highest carrier frequency where temporal fine structure
following by the auditory system is impossible. A periodicity coding
mechanism based on detection of maxima would be affected by such a
change. Recent results obtained in the field of comparative psychology
[5] indicated that members of other species also seem to be
sensitive to auditory roughness. Therefore, it may be plausible that
roughness derives from ubiquitous physiological mechanisms such as
periodicity coding. An alternative interpretation of the results could
therefore be that the temporal fine structure of the modulation
present at the level of primary auditory nerve fibers has an influence
on roughness perception.
c condition). If one is interested in more subtle
differences of recorded or synthesized sounds, temporal models will
therefore be better suited. These models would reproduce the overall
roughness variation with envelope rms but would fail to
reproduce the difference observed between positive and negative phase
condition. It may be argued that in free field listening conditions
the effect of phase differences will be smeared out by sound
propagation and reflections. However, the study of the influence of
phase effects in a laboratory-like situation was a means to try to
gain some insights in the mechanisms involved in roughness perception,
that may turn out as determinant when carrying on to understand
roughness of complex musical sounds. Our claim is not that phase per
se should be considered as an extra parameter, but rather that only a
model based on auditory peripheral mechanisms will be able to include
in a natural way all the dependencies of roughness on various
acoustical features.
[2]
E. Bigand, R. Parncutt, and F. Lerdahl.
Perception of musical tension in short chord sequences : the
influence of harmonic function, sensory dissonance, horizontal motion, and
musical training.
Perception and Psychophysics, 58(1):125--141, 1996.
[3]
P. G. Butler, J. W. amd Daston.
Musical consonance as musical preference: a cross-cultural study.
Journal of General Psychology, 79:129--142, 1963.
[4]
P. Daniel and R. Weber.
Psychoacoustical roughness: Implementation of an optimized model.
Acustica, 83:113--123, 1997.
[5] S. H. Hulse, D. J. Bernard, and
R. F. Braaten. Auditory discrimination of chord-based
spectral structures by european starlings (sturnus vulgaris).
J. Exp. Psych.: Gen, 124(4):409--423, 1995.
[6]
Hermann L. F. von Helmholtz.
On the Sensations of Tone as the Physiological Basis for the
Theory of Music.
1885. 2nd ed. trans. A. J. Ellis, from German 4th ed. (1885), Reprinted,
Dover, New York (1954).
[7]
W. Hutchinson and L. Knopoff.
The acoustic component of Western consonance.
Interface, 7:1--29, 1978.
[8]
R. D. Patterson, M. H. Allerhand, and C. Giguere.
Time-domain modelling of peripheral auditory processing: A modular
architecture and a software platform.
J. Acoust. Soc. Am., 98:1890--1894, 1995.
[9] R. Plomp and W. Levelt. Tonal
consonance and critical bandwidth. {\em
J. Acoust. Soc. Am.}, 38:548--560, 1965.
[10]
D. Pressnitzer, S. McAdams, S. Winsberg, and J. Fineberg.
Roughness and musical tension of orchestral timbres.
In Proceedings of the 4th International Conference on Music
Perception and Cognition, pages 85--90, Montréal, Canada, August 1996.
[11]
E. Terhardt.
On the perception of periodic sound fluctuation (roughness).
Acustica, 30:201--212, 1974.
____________________________ ____________________________
Server © IRCAM-CGP, 1996-2008 - file updated on .
Serveur © IRCAM-CGP, 1996-2008 - document mis à jour le .